Earlier in 2016, TipRanks released its award winning Smart Portfolio platform. Hundreds of thousands of individual investors now use this platform to track and optimize their investment portfolio and make even better investment decisions. We compiled an average portfolio from the top 100 portfolio managers in 2016 to find the secret sauce of their investing success.
TipRanks’ top 100 investors made an average return of 36% in 2016, tripling the index return of 11.96%. Their combined 25 stock portfolio is composed of large cap stocks which crushed the market, such as chip makers Advanced Micro Devices (AMD), Nvidia (NVDA), Micron (MU) up 295%, 227% and 55% respectively.
Want to be a top-100 investor? Find investment inspiration from the stock holdings of this model portfolio and see how you can use TipRanks to improve your own investment portfolio.
In this article we will cover the portfolio’s 3 most profitable stocks; the sector breakdown; and the stock breakdown for each sector.
The 3 Most Profitable Stocks
Investors with stocks in chip makers were clearly onto something! We can see that the holding’s three most profitable stocks (AMD, Nvidia and Micron) were all chip makers- with AMD winning the award of top stock.
AMD- The Advanced Micro Device holding made an impressive return of 12.1% while shares surged by 295%. And according to top analyst, Jefferies’ Mark Lipacis, the company will continue to outperform in 2017. Lipacis has an 81% success rate and 27% average return, according to TipRanks’ financial accountability engine.
Lipacis recently reiterated his buy rating for AMD with a $14 price target (22.87% upside). He also raised his 2017 estimates to revenue of $5.26 billion and EPS of 32 cents to account for the company’s new Ryzen microprocessor and Vega graphics processor (GPU).
“We’ve argued that AMD’s IP is undervalued and that it is in the midst of a turnaround,” Lipacis says, “and AMD’s demos this week of its new Zen MPU in high-end performance applications reinforce the latter part of this thesis.”
“Our checks continue to indicate AMD’s Zen MPU is being well received in the enthusiast DT channel, and the Asia Cloud Server market” writes Lipacis, who says that the Ryzen chip “will be the first performance MPU from AMD in recent history.”
However, the analyst outlook for AMD as a whole is more muted- the analyst consensus rating for AMD is Moderate Buy while the average analyst price target is $10.04- a downside of -5.1% from the current share price.
One of the bears is UBS’ Stephen Chin who reiterated his AMD sell rating recently with a $5.50 price target, marking a whopping -48% downside from the $10.58 share price. Chin is concerned that any processor performance advantages against giant Intel will be short-lived due to Intel’s latest 7th generation Kaby Lake chip and further chip launches later this year.
Nvidia- also a Moderate Buy analyst consensus rating on TipRanks, Nvidia shares rose 226% bringing a portfolio return of 10.33%. Five-star rated Chin may be bearish on AMD but he is bullish on Nvidia given its potential strong sales growth. He is confident that data center chip sales for machine learning can be sustained. The analyst average price target for NVDA on TipRanks is $107.30- a 3.74% upside from the current share price.
Micron- out of these three stocks, analysts are the most bullish on Micron which has a strong buy analyst consensus rating on TipRanks. In fact, in the last 25 days, 16 analysts reiterated their buy ratings for this semiconductor company which specializes in dynamic random-access memory, flash memory, and solid-state drives.
Most recently, Loop Capital Markets’ Betsy Van Hees reiterated her buy rating with a $27 price target (21.73% upside). She says “With the positive DRAM data points and our industry checks continuing to point to favorable near-term NAND supply/ demand dynamics, we recommend investors with a higher risk/reward tolerance take advantage of the recent weakness to add to positions.” Van Hees is ranked #84 out of 4,346 analysts tracked by TipRanks. In terms of the top portfolio- Micron shares rose 55% bringing a portfolio return of 2.47%.
The Sectors
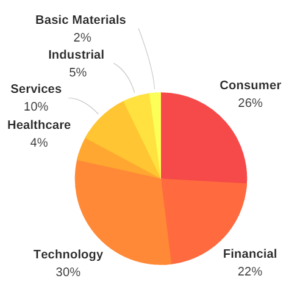
As may be expected, in 2016, the average top performing portfolio had a majority of its stocks in the tech sector (30%) followed by stocks in the consumer sector (26%) and the financial sector (22%).
The Stock Breakdown
Now let’s breakdown the average portfolio a bit further and check out how each holding performed in 2016.
We can see that there are 2 loss-making holdings: controversial electric car-maker Tesla (TSLA) and Gilead Sciences (GILD). In 2016, Gilead Sciences lost $40 billion in value, even though none of its top-selling drugs went off patent, due the poor performance of its hep-C franchise and failure to find suitable acquisition targets.
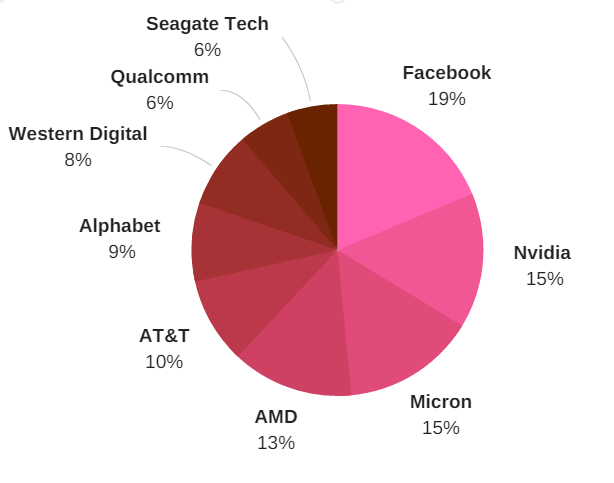
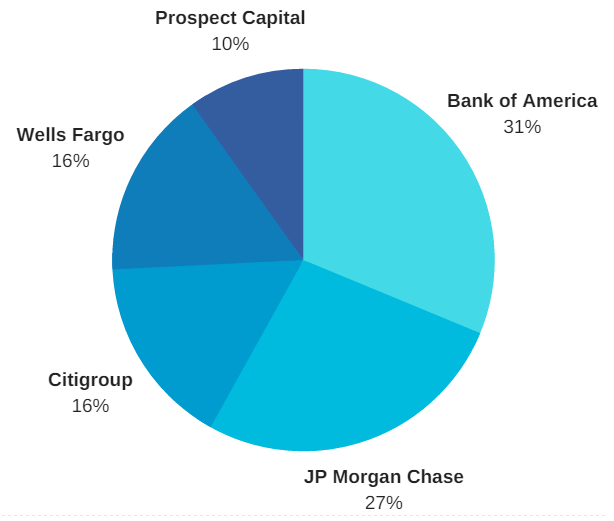
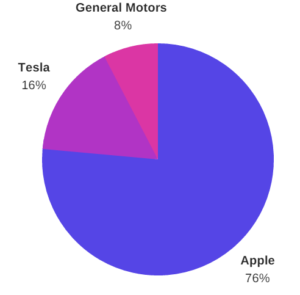
We also include charts which show the proportion of stocks held in each sector e.g. over 30% of the portfolio’s financial sector stocks are from Bank of America.
Tech
The Facebook holding made a gain of 0.57%, Nvidia shares brought an impressive return of 10.33%, Micron shares, 2.47%, Advanced Micro Devices made the best return of 12.1%, AT&T made 0.87%, Alphabet brought a marginal return of 0.05%, Western Digital 0.45%, Qualcomm, 0.61% and finally Seagate Tech gave a 0.23% return.
Financial
The Bank of America holding made a return of 2.31%, similarly JP Morgan Chase shares made a gain of 2.05%, Citigroup brought in 0.57%, Wells Fargo, 0.16% and Prospect Capital, 0.79%.
Consumer goods– Apple shares made a 2.47% return while General Motors made a gain of 0.15% and Tesla a loss of -0.45%.
Services– The Amazon holding made a gain of 0.45%, the American Airlines shares made 0.34% while the Walt Disney shareholding made a marginal return of 0.02%.
Industrial goods– The shares in General Electric made a gain of 0.12% while the Boeing holding also returned 0.29%.
Healthcare– The one healthcare sector stock, Gilead Sciences, made a loss of 1.2%.
Basic materials– The BP holding, the only basic materials holding, made a gain of 0.63%.
Now You Can Do It Too- TipRanks’ Insights
How can you take advantage of TipRanks to improve your investment strategy and make better investment decisions?
Ranking of experts– as the name suggests TipRanks ranks financial experts based on their success rate and average return. Follow the top analysts, bloggers, hedge fund managers and corporate insiders to receive the most accurate and reliable financial advice. You can also rank the experts by sector and adjust the ranking for short or long term investments to better match your investment strategy.
Crowd insights– TipRanks’ award winning Smart Portfolio platform allows users to benefit from crowd wisdom by comparing their portfolio to the average user portfolio in terms of stock allocation, asset allocation and even portfolio risk and dividend yield. You can even see how the average portfolio’s ETFs and mutual funds differs from your own ETF/ mutual holding.
Click here to create your own TipRanks’ Smart Portfolio Account!


